Categories
#GreaterPrincetonNJ

Here’s how much home prices have changed this year in each N.J. … – NJ.com

Reading Time: < 1 minute
Categories
#GreaterPrincetonNJ

Here’s how much home prices have changed this year in each N.J. county – NJ.com

Reading Time: < 1 minute
Categories
#GreaterPrincetonNJ

THE WOLF STREET REPORT: Housing Bubble Getting Ready to Pop – The Big Boys Leave, Waiting for Reset – WOLF STREET

Reading Time: < 1 minute

Biggest investors in single-family houses: “We need to be patient and allow the market to reset” (you can also download the WOLF STREET REPORT wherever you get your podcasts).

Enjoy reading WOLF STREET and want to support it? Using ad blockers – I totally get why – but want to support the site? You can donate. I appreciate it immensely. Click on the beer and iced-tea mug to find out how:

BeerMug2

Would you like to be notified via email when WOLF STREET publishes a new article? Sign up here.

placeholder2


Categories
#GreaterPrincetonNJ

Existing-Home Sales Fall for the Sixth Straight Month, Decline 5.9% in July 2022 – NAR.realtor

Reading Time: 3 minutes

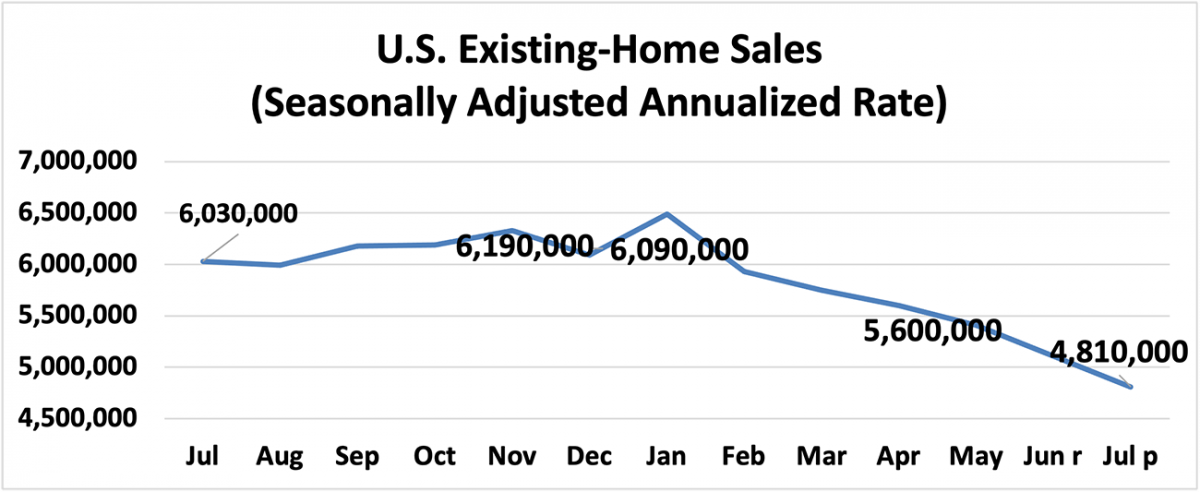
NAR released a summary of existing-home sales data showing that housing market activity this July fell 5.9% from June 2022. July’s existing-home sales reached a 4.81 million seasonally adjusted annual rate. July’s sales of existing homes declined 20.2% from July 2021. July’s sales represent the sixth consecutive month of decline.

Line graph: U.S. Existing-Home Sales, July 2021 to July 2022

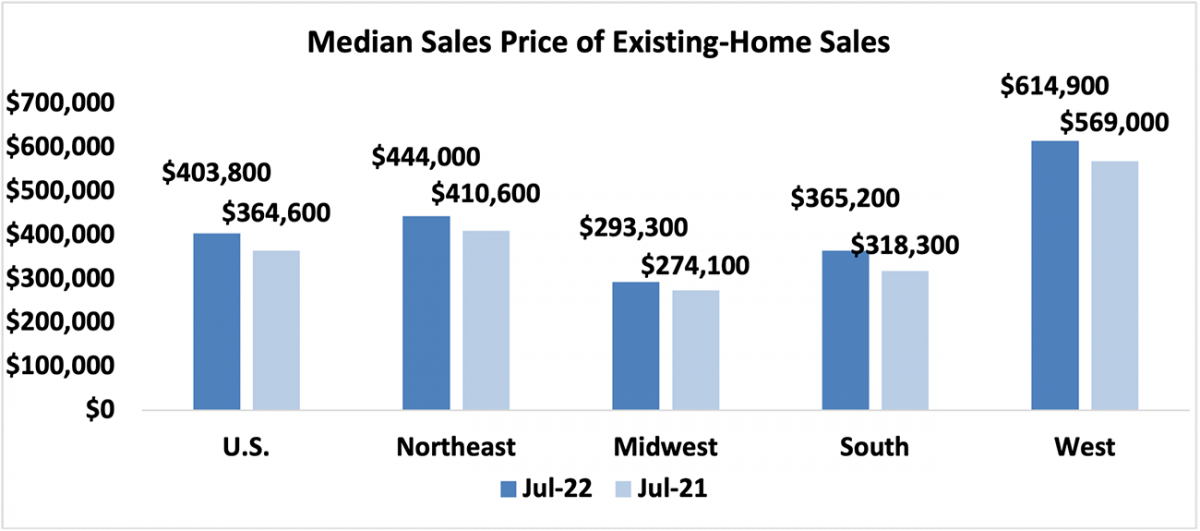
The national median existing-home price for all housing types reached $403,800 in June, up 10.8% from a year ago. Home prices have continued to climb, marking the 125th consecutive month of year-over-year gains.

Bar graph: U.S. and Regional Median Sales Price of Existing Homes, July 2022 and July 2021

Regionally, in July, all four regions showed strong price growth from a year ago. The South had the most significant gain of 14.7%, followed by the Northeast and the West; both shared an incline of 8.1%. The Midwest had the smallest price gain of 7.0% from July 2021.

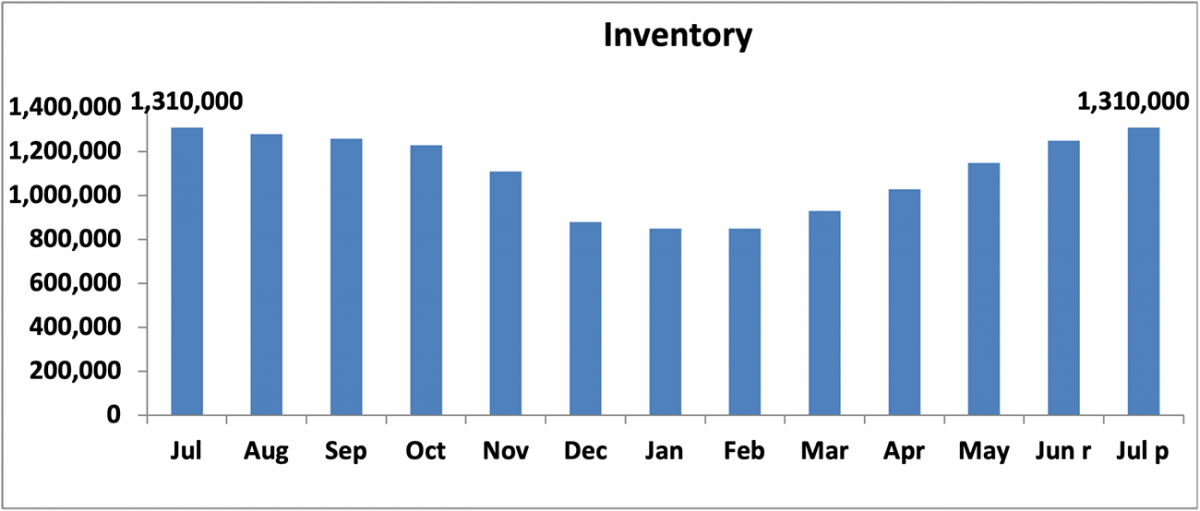
July’s inventory of unsold listings as of the end of the month rose 4.8% from last month, standing at 1,310,000 homes for sale. Compared with July of 2021, inventory levels were flat. It will take 3.3 months to move the current inventory level at the current sales pace, well below the desired rate of 6 months.

Demand remains strong as home buyers are snatching listings quickly off the MLS, and it takes approximately 14 days for a home to go from listing to a contract in the current housing market. A year ago, it took 17 days.

Bar graph: Inventory, July 2021 to July 2022

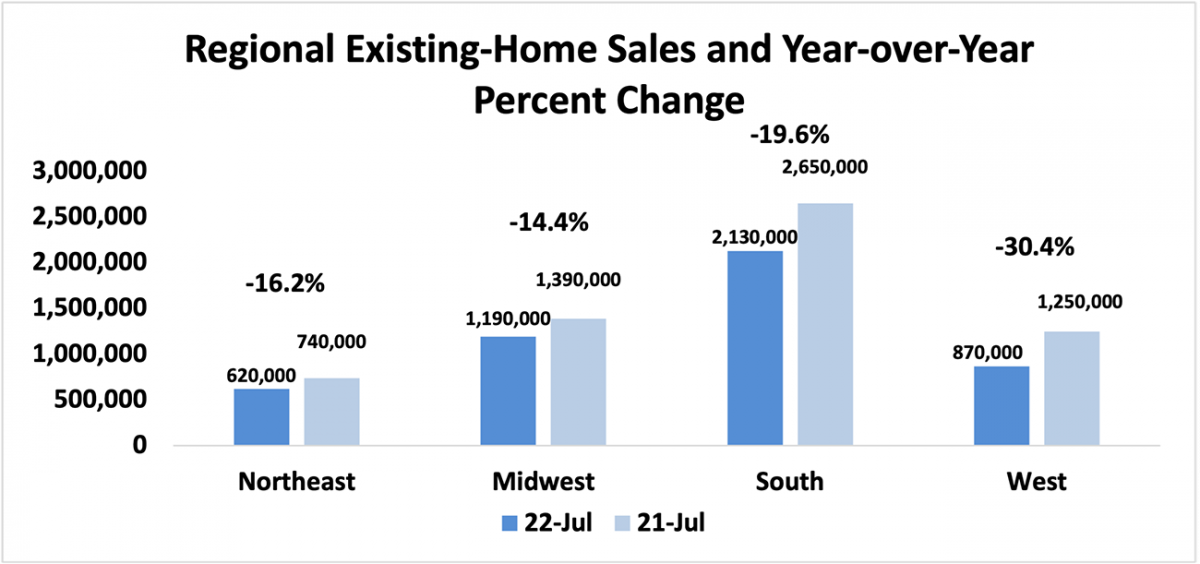
Compared to a year ago, all of the four regions had double-digit declines in sales in July. The West had the most significant dip of 30.4%, followed by the South, which fell 19.6%. The Northeast decreased 16.2%, followed by the Midwest, down 14.4%.

Compared to June 2022, all four regions also showed reductions in sales. The West region had the most significant decline of 9.4%, followed by the Northeast with a drop of 7.5%. The South fell 5.3%, followed by the Midwest with the most minor dip in sales of 3.3%.

The South led all regions in percentage of national sales, accounting for 44.3% of the total, while the Northeast had the smallest share at 12.9%.

Bar graph: Regional Existing-Home Sales and Year-Over-Year Percent Change, July 2022 and July 2021

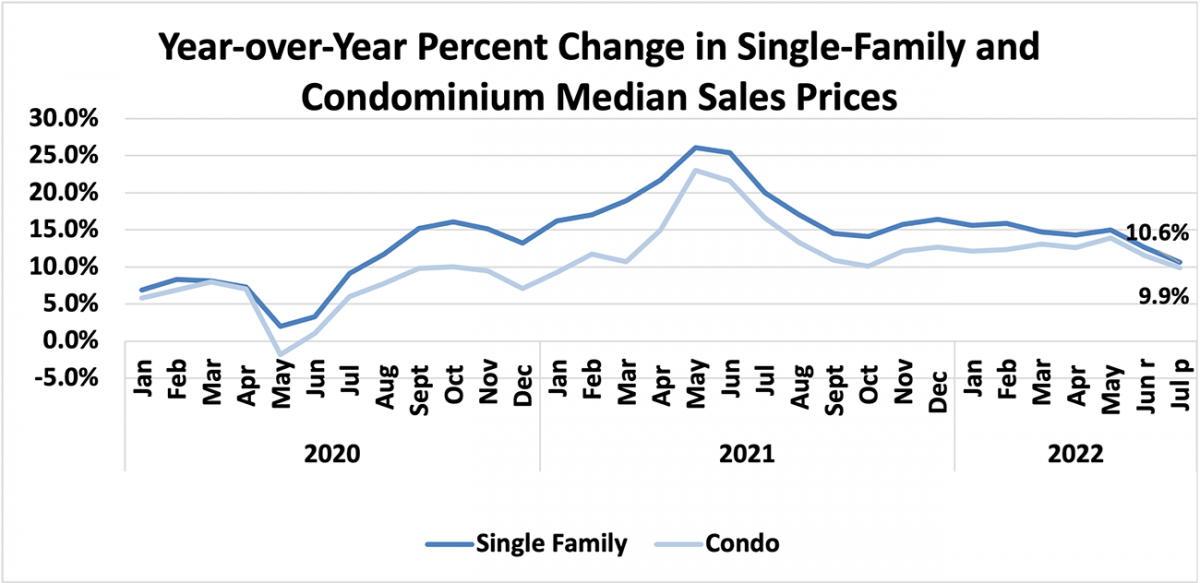
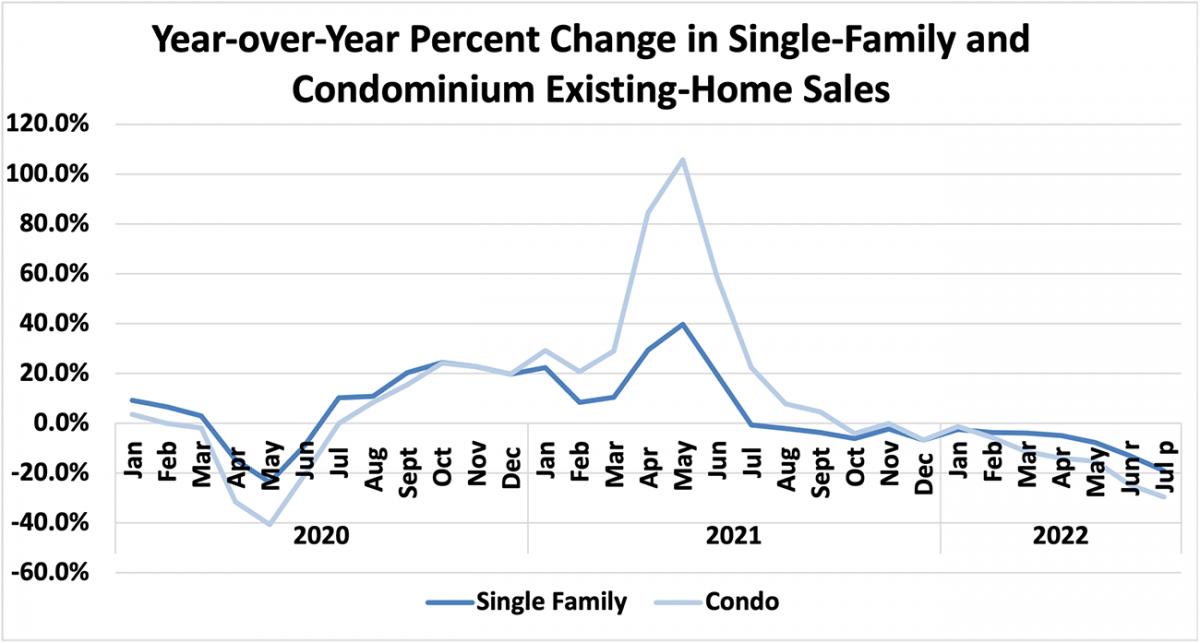
In July, single-family sales decreased 5.5%, and condominium sales fell 9.1% compared to last month. Single-family home sales were 19.0%, while condominium sales fell 29.6% compared to a year ago. The median sales price of single-family homes rose to 13.3% at $410,600 from July 2021, while the median sales price of condominiums rose 9.9% to $345,000.

Line graph: Year-Over-Year Percent Change in Single-family and Condominium Median Sales Prices, January 2020 to July 2022
Line graph: Year-Over-Year Percent Change in Single-family and Condominium Existing-Home Sales, January 2020 to July 2022
Categories
#GreaterPrincetonNJ

Top States with Counties Most Vulnerable to Housing Market Declines – ATTOM Data Solutions

Reading Time: 3 minutes
Q2 2022 Housing Risk Report CROPPED

ATTOM’s newly released Q2 2022 Special Housing Risk Report shows that New Jersey, Illinois and inland California continued to have the highest concentrations of the most-at-risk markets in the second quarter. According to the report, the biggest clusters were in the New York City and Chicago areas, while the Southern and midwestern states remained less exposed.

ATTOM’s housing risk report spotlights county-level housing markets around the U.S. that are more or less vulnerable to declines, based on home affordability, unemployment and other measures. The Q2 2022 report looked at counties that were considered more or less at risk based on the percentage of homes facing possible foreclosure, the portion with mortgage balances that exceeded estimated property values, the percentage of average local wages required to pay for major home ownership expenses on median-priced single-family homes, and local unemployment rates.

The conclusions notated in the report were drawn from an analysis of the most recent home affordability, equity and foreclosure reports prepared by ATTOM, while unemployment rates came from federal government data. Rankings were then based on a combination of those four categories in 575 counties around the U.S. with sufficient data in Q2 2022. Counties were then ranked in each category, from lowest to highest, with the overall conclusion based on a combination of the four ranks.

According to the report, New Jersey, Illinois and California had 27 of the 50 counties most vulnerable to potential declines, with the 50 most at-risk including seven in and around New York City, eight in the Chicago metro, and eight spread through northern, central and southern California. The report stated the rest of the top 50 counties were scattered across the U.S., including three in the Cleveland, OH, metro area and all three counties in Delaware. Meanwhile, at the other end of the risk spectrum, less exposed markets were located mainly across southern, northeastern and midwestern states.

In this post, we dig into the data behind the ATTOM Q2 2022 Special Housing Risk Report to reveal the other top states with the most counties vulnerable to housing market declines. Those states with the most at-risk counties among the top 50 most vulnerable include: Illinois (11 counties); New Jersey (8 counties); California (8 counties) and Ohio (4 counties).

Also, in this post, we dig into the data behind the ATTOM Q2 2022 Special Housing Risk Report to reveal the top states with the most counties that are least vulnerable to housing market declines. Those states with the most counties among the bottom 50 least-at-risk include: New Hampshire (4 counties), New York (4 counties) and Wisconsin (4 counties).

ATTOM’s latest report noted that major home ownership costs on median-priced single-family homes consumed more than one-third of average local wages in 27 of the 50 counties that were most vulnerable to market problems in Q2 2022. The report also noted that at least 7 percent of residential mortgages were underwater in Q2 2022 in 33 of the 50 most at-risk counties, while nationwide, 5.9 percent of mortgages fell into that category. Also, more than one in 1,000 residential properties faced a foreclosure action in Q2 2022 in 42 of the 50 most at-risk counties; while nationwide, one in 1,559 homes were in that position.

Want to learn more about housing risk in your market? Contact us to find out how!

Categories
#GreaterPrincetonNJ

California Housing Market: Dismal Sales, Prices Sag in San Francisco (-20% fr. peak), Silicon Valley, San Diego, Orange County… – WOLF STREET

Reading Time: 6 minutes

And this was during the summer rally as mortgage rates dropped to 5%, stocks bounced, the Fed “pivoted,” and the Good Times started all over again.

By Wolf Richter for WOLF STREET.

Home sales that closed in August were made somewhere from a few days to a couple of months before they closed – so roughly around and before the peak of the summer bear-market rally in mortgage rates and stocks that started in mid-June and ended in mid-August.

By mid-June, the average 30-year fixed rate mortgage was at or above 6%, having doubled in less than a year. And stocks had sunk. But then the tightening-deniers fanned out and trolled the media with nonsense about the Fed being “dovish,” that it would “pivot” in September or whatever, and they declared that inflation was “over,” etc. etc., and stocks bounced off their mid-June lows and mortgage rates fell from 6% to 5%, and for a moment just below 5%. And Realtors were already talking about how the housing market was picking up again.

Now we know that all this was a hoax. Mortgage rates are now solidly over 6%.  Fed chair Powell finally got through to everyone with his Jackson Hole speech that the Fed will tighten further. Inflation got worse and has shifted to services, from where it’s difficult to dislodge. And the stock market, now finally seeing inflation and higher rates, has given up most of the bear-market rally gains.

But back then, it seemed real enough to lots of people. In the San Francisco Bay Area and in Southern California – whose housing markets are heavily dependent on the stock market – there were hopes of an uptick amid re-surging stock prices, plunging mortgage rates, and gorgeously imagined Fed pivots. Those were the Good Times. So here is what we got instead from the California Association of Realtors for August:

Prices sank further. In four of the five big Bay Area counties, prices were down year-over-year. Sales volume was dismal, though slightly less dismal than the collapse in July. Time on the market about doubled year-over-year. And supply surged year-over-year.

San Francisco County leads:

Sales volume, single-family houses (SFH): -24% year-over-year, slightly less dismal than -26% in July.

Median time on the market: 20 days, up from 15 days in July, and up from 11 days a year ago.

Supply of unsold inventory: 2.2 months, same as in July, compared to 1.7 months a year ago.

Median Price, single-family houses: $1.635 million, lowest price for any August since 2019 ($1.60 million): -3.8% from July, fifth month in a row of declines, -20.6% from peak in March, -11.6% year-over-year.

In San Francisco, prices usually hit their seasonal lows in January or February; so this will be interesting. The green line connects the Augusts:

US california housing CAR 2022 09 16 San Francisco

These are massive price declines in San Francisco. Yes, median prices are volatile, and we look at them with a good dose of circumspection, and trends need to be confirmed over time. But this trend here is being confirmed nicely so far.

One glance at the chart tells us that the median price will eventually bounce again, to zigzag lower rather than to go to heck in a straight line.

Santa Clara County, southern Silicon Valley.

Sales volume, single-family houses: -28% year-over-year, less dismal than -46% in July.

Median time on the market: 16 days, up from 14 days in July, and up from 8 days a year ago.

Supply of unsold inventory: 2.0 months, compared to 2.6 months in July, and 1.4 months a year ago.

Median Price, single-family houses, $1.65 million: -5.2% from July, fourth month in a row of declines, -15.4% from peak in April, -0.3% year-over-year:

US california housing CAR 2022 09 16 Santa Clara

San Mateo County, northern Silicon Valley.

Sales volume, single-family houses: -30% year-over-year, slightly less dismal than -35% in July.

Median time on the market: 14 days, up from 12 days in July, and up from 9 days a year ago.

Supply of unsold inventory: 2.3 months, compared to 2.2 months in July, and 1.5 months a year ago.

Median Price, single-family houses, $1.95 million: -0.8% from July, fourth month in a row of declines, -14.5% from peak in April, +1.3% year-over-year:

US california housing CAR 2022 09 16 San Mateo

Alameda County, East Bay.

Sales volume, single-family houses: -30% year-over-year, less dismal than -35% in July.

Median time on the market: 16 days, up from 13 days in July, and up from 9 days a year ago.

Supply of unsold inventory: 2.1 months, compared to 2.4 months in July, and 1.3 months a year ago.

Median Price, single-family houses, $1.23 million: -8.2% from July, third month in a row of declines, -14% from peak in May, -5.4% year-over-year:

US california housing CAR 2022 09 16 Alameda

Contra Costa County, East Bay.

Sales volume, single-family houses: -27% year-over-year, less dismal than -36% in July.

Median time on the market: 18 days, up from 13 days in July, and more than double the 9 days a year ago.

Supply of unsold inventory: 2.3 months, compared to 2.5 months in July, and 1.4 months a year ago.

Median Price, single-family houses, $870,000: -3.6% from July, fourth month in a row of declines, -10% from peak in April, -2.2% year-over-year:

US california housing CAR 2022 09 16 Contra Costa

Southern California trying to catch up.

In Southern California overall, house prices fell for the third month in a row, -5.9% from the peak, which whittled the year-over-year gain down to 4.6%. So here are the three biggest counties. In San Diego, the median price dropped nearly 5% from July. In Orange, it dropped 2.5%, but it ticked up in Los Angeles. So here we go, starting with the most splendid housing bubble, San Diego.

San Diego County.

Sales volume of single-family houses: -28% year-over-year, less dismal than -41% in July.

Median time on the market: 15 days, up from 10 days in July, and nearly double the 8 days a year ago.

Supply of unsold inventory: 2.5 months, compared to 3.1 months in July, and 1.7 months a year ago.

Median Price, single-family houses, $885,000: -4.8% from July, fourth month in a row of declines, -9% from peak in April, which cut the year-over-year gain to +6.0%:

US california housing CAR 2022 09 16 San Diego

Orange County.

Sales volume of single-family houses: -30% year-over-year, less dismal than -39% in July.

Median time on the market: 17.5 days, up from 13 days in July, more than double the 8 days a year ago.

Supply of unsold inventory: 2.5 months, compared to 3.0 months in July, and 1.6 months a year ago.

Median Price, single-family houses, $1.2 million: -2.5% from July, fourth month in a row of declines, -9% from peak in April, which cut the year-over-year gain to +9.1%:

US california housing CAR 2022 09 16 orange

In Los Angeles County.

Sales volume of single-family houses: -29% year-over-year, slightly less dismal than -32% in July.

Median time on the market: 16 days, up from 13 days in July, nearly double the 9 days a year ago.

Supply of unsold inventory: 3.1 months, compared to 3.3 months in July, and 2.0 months a year ago.

Median Price, single-family houses, $855,000: +1.0% from July, -3.5% from peak last September, +3.0% year-over-year:

US california housing CAR 2022 09 16 Los Angeles

Enjoy reading WOLF STREET and want to support it? Using ad blockers – I totally get why – but want to support the site? You can donate. I appreciate it immensely. Click on the beer and iced-tea mug to find out how:

BeerMug2

Would you like to be notified via email when WOLF STREET publishes a new article? Sign up here.

placeholder2


Categories
#GreaterPrincetonNJ

Existing-Home Sales Fall for the Seventh Straight Month and Decline 0.4% in August 2022 – NAR.realtor

Reading Time: 3 minutes

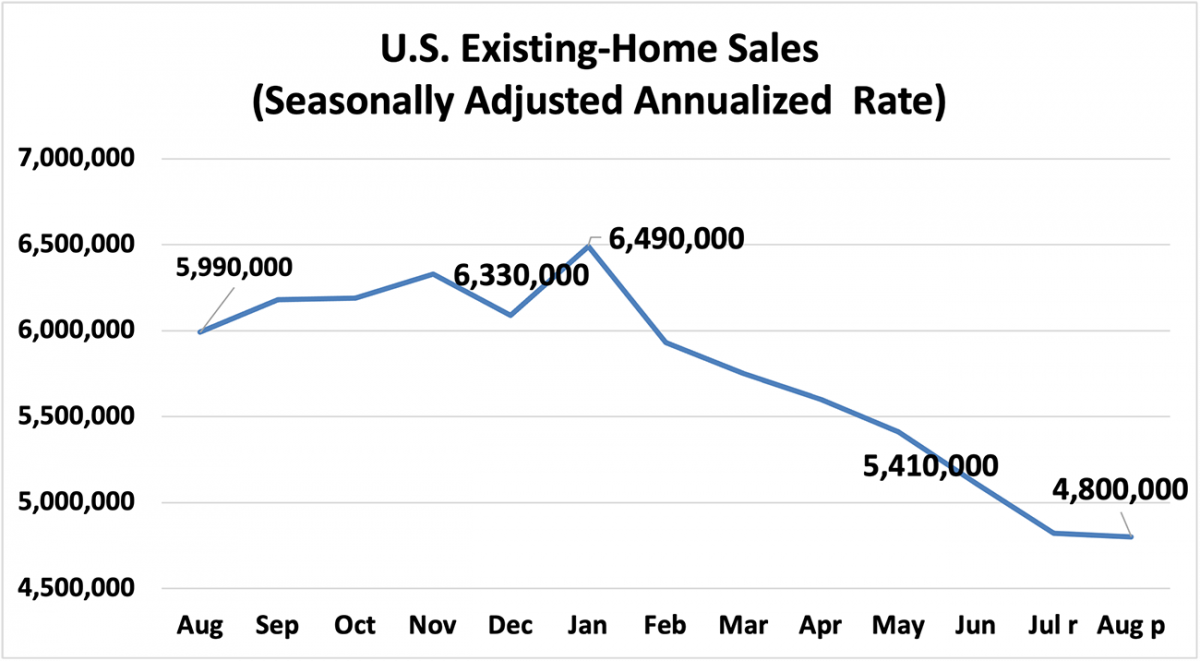
NAR released a summary of existing-home sales data showing that housing market activity this August fell modestly (0.4%) from July 2022. August’s existing-home sales reached a 4.80 million seasonally adjusted annual rate. August’s sales of existing homes declined 19.9% from August 2021. August’s sales represent the seventh consecutive month of declines, and sales were the weakest since May 2020.

Line graph: U.S. Existing-Home Sales, August 2021 through August 2022

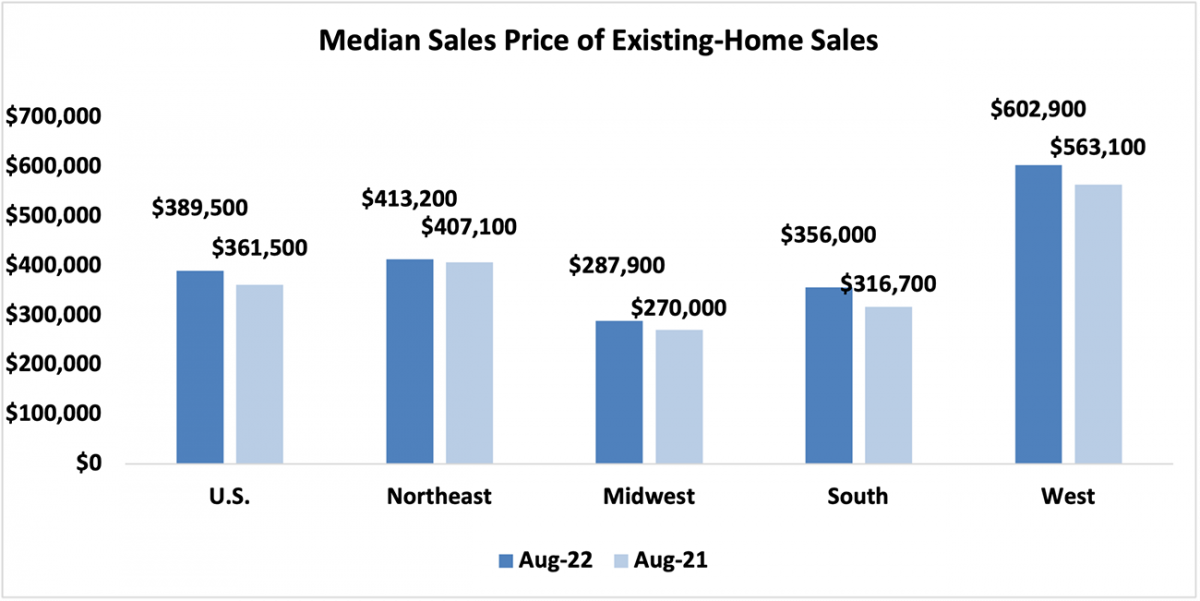
The national median existing-home price for all housing types reached $389,500 in August, up 7.7% from a year ago. Home prices have continued to climb, marking the 126th consecutive month of year-over-year gains.

Bar graph: U.S. and Regional Median Sales Price of Existing Homes, August 2022 and August 2021

Regionally, in August, all four regions showed strong price growth from a year ago. The South had the most significant gain of 12.4%, followed by the West, with an incline of 7.1%. The Midwest had an increase of 6.6%, followed by the Northeast, with the smallest price gain of 1.5% from August 2021.

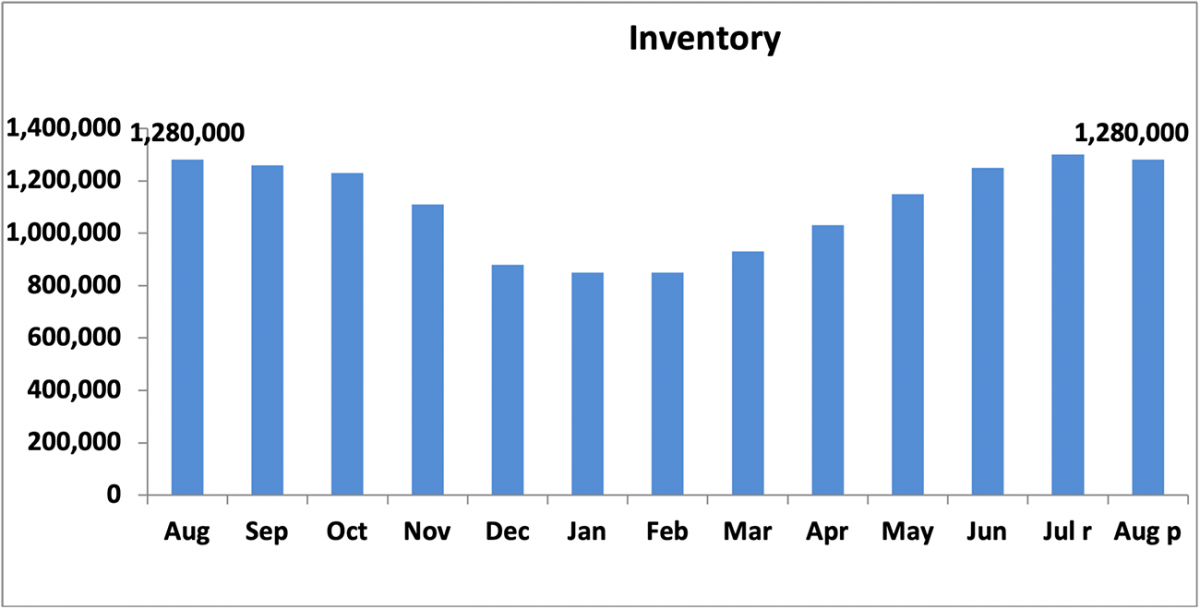
August’s inventory of unsold listings, as of the end of the month, fell 1.5% from last month, standing at 1,280,000 homes for sale. Compared with August 2021, inventory levels were flat. It will take 3.2 months to move the current inventory status at the current sales pace, well below the desired pace of 6 months.

Demand remains strong as home buyers are snatching listings quickly off the MLS, and it takes approximately 16 days for a home to go from listing to a contract in the current housing market. A year ago, it took 17 days.

Bar graph: Inventory, August 2021 to August 2020

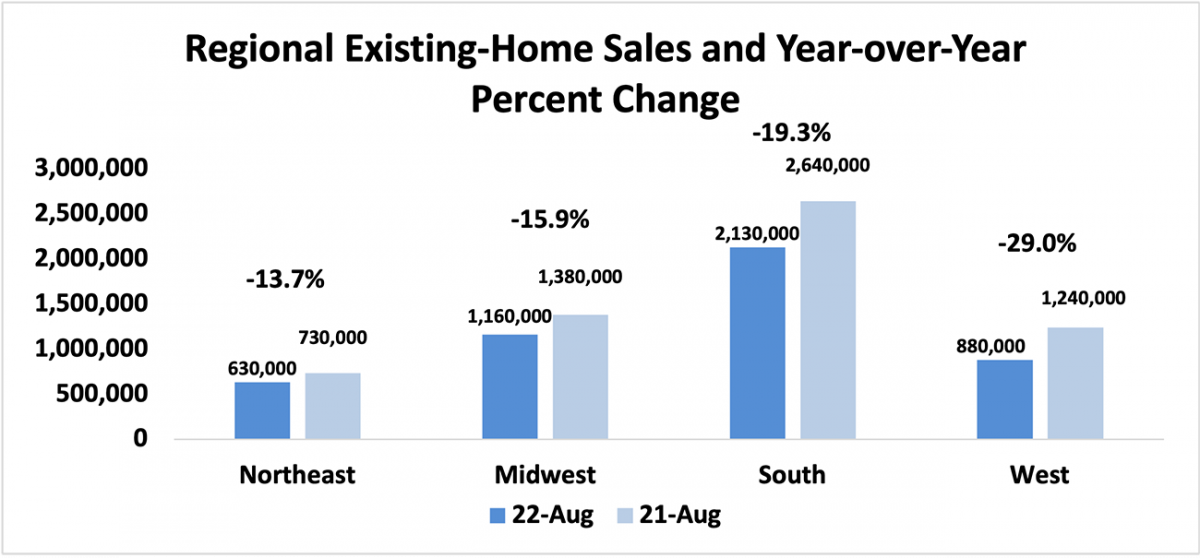
From a year ago, all of the four regions had double-digit declines in sales in August. The West had the most significant dip of 29.0%, followed by the South, which fell 19.3%. The Midwest decreased 15.9%, followed by the Northeast, which was down 13.7%.

Compared to July 2022, only the Midwest region showed a reduction in sales (3.3%) in August. The Northeast region had the most significant incline of 1.6%, followed by the West with an increase of 1.1%. The South region was flat with no change in sales.

The South led all regions in percentage of national sales, accounting for 44.4% of the total, while the Northeast had the smallest share at 13.1%.

Bar graph: Regional Existing-Home Sales and Year-Over-Year Percent Change, August 2022 and August 2021

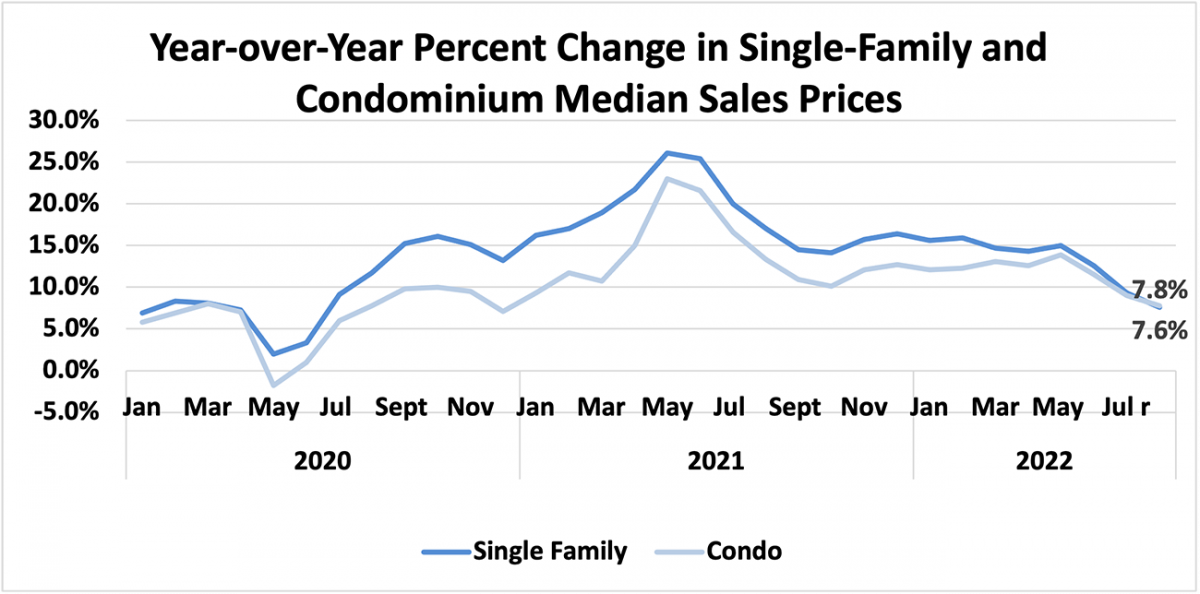
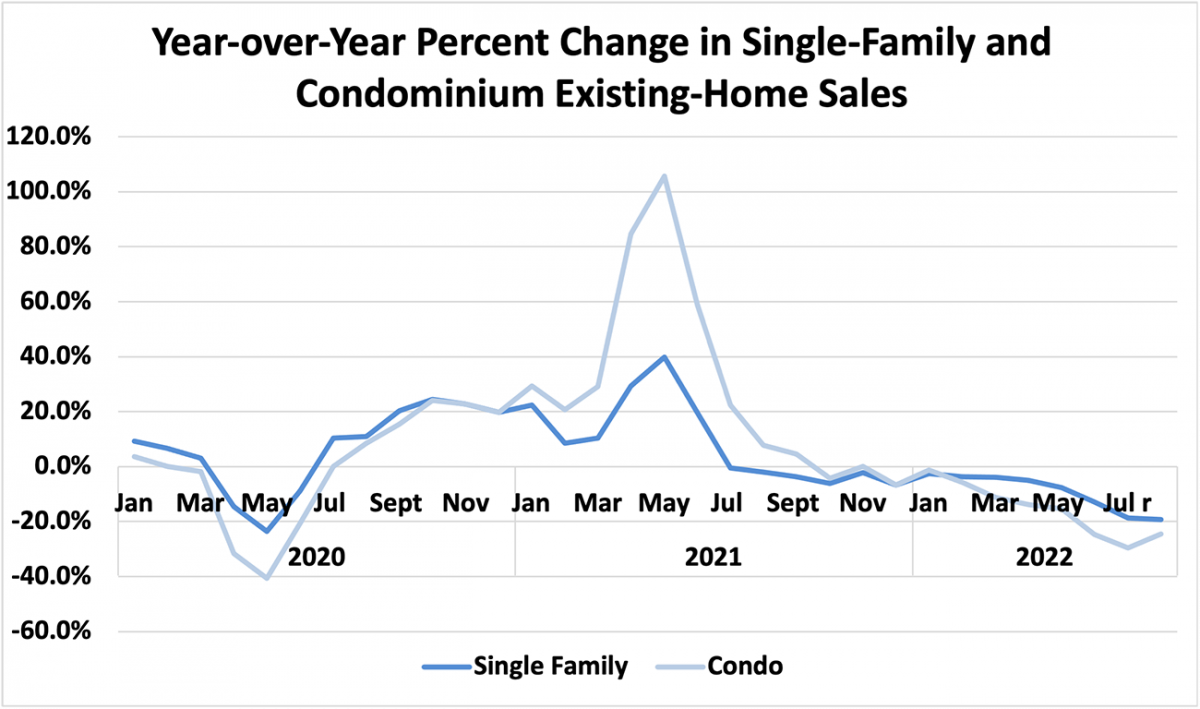
In August, single-family sales decreased 0.9%, and condominium sales rose 4.0% compared to last month. Single-family home sales were 19.2%, while condominium sales fell 24.6% compared to a year ago. The median sales price of single-family homes rose to 7.6% at $396,300 from August 2021, while the median sales price of condominiums rose 7.8% to $333,700.

Line graph: Year-Over-Year Percent Change in Single-family and Condominium Median Sales Prices, January 2020 to July 2022
Line graph: Year-Over-Year Percent Change in Single-family and Condominium Existing-Home Sales, January 2020 to July 2022
Categories
#GreaterPrincetonNJ

Who is buying in today’s housing market? – Sacramento Appraisal Blog

Reading Time: < 1 minute


Who is buying in today’s housing market? – Sacramento Appraisal Blog | Real Estate Appraiser Skip to content

Categories
#GreaterPrincetonNJ

The best time to buy a home could be right now – The Philadelphia Inquirer

Reading Time: 3 minutes
3FQOH36Q6ZHC5D5IFCQXH54AFQ

If you’re looking to buy a home, the right time could be right now.

A new analysis of U.S. home sales from 2013 to 2021 found that October had the lowest average premiums of any month, followed closely by the fall and winter months.

The analysis from Attom, a firm specializing in real estate and property data for more than 155 million properties in the country, used data from any day with more than 10,000 home sales.

“We took a look at what people pay for properties relative to list prices at various times of the year and the lowest premium over list price tends to happen in the fall and winter months,” Rick Sharga, executive vice president of market intelligence at Attom, explained.

Alban Xhema, a licensed real estate salesperson in Philadelphia, said less competition during the end of the year can make buyers’ offers more attractive but notes that low inventory also may make buyers more willing to jump on a property if they’re home shopping during this time.

“I don’t think sellers are any more willing to make concessions in the fall or winter,” Xhema said, adding that the fewer buyers who are shopping create competition among themselves.

Still, when you’re making the most attractive offer out of five instead of out of 15, your chances of sealing the deal are higher.

» READ MORE: Large investors are increasingly buying up homes in Philly. Here’s what that means for owners and renters.

“That’s what I think is really the main driver: You have less buyers raising the price, coming in with better terms, coming in with better financing, or having more cash to put down,” Xhema said.

Attom’s analysis also took a look at the best time to buy in every state.

In Pennsylvania, “it’s a little later in the winter than in other parts of the country, but basically from fall on is when you get the best deals,” Sharga said. December was the best time to buy in the Keystone State, according to Attom, with a 0.9% discount off market value.

Sales in New Jersey saw prices fall the most in February, when they dipped 3.9% below market value. That was the steepest discount of any month in any state.

Because Attom’s data extended so far before COVID hit, it gives a particularly clear view of which trends shifted during the pandemic.

“We did see a change in seasonal patterns,” Sharga said.

» READ MORE: Home buyers this summer saw mortgage rates swing up and down more than at any time since 1987

After losing the spring and summer home-selling season in 2020, “we saw a lot of unusually strong home sales in the latter half of the year,” he said, noting some “side effects that you wouldn’t have normally expected to see in the housing market that time of year.”

Sharga said most families tend to search for houses during the spring and summer after school lets out. The pandemic changed that for some.

» READ MORE: More home buyers are considering adjustable-rate mortgages as interest rates rise

“A lot of people just opted to move when they could find something they could afford to buy in a place where they wanted to live” while they were working from home, he said. “Historically … a very high percentage of homeowners and families tend not to like to disrupt kids in the middle of the school year. [Now] people were moving in a job-related manner rather than around the school year.”

That shift in when people were buying, however, didn’t affect pricing trends, Sharga said.

“There still was some seasonality in pricing even though the prices were all going up. They would just go up a little bit slower in the fall winter months,” he said.

Categories
#GreaterPrincetonNJ

Best places to live on the East Coast – Gwinnettdailypost.com

Reading Time: < 1 minute
637ce770c8444.image