Buying or Selling in Greater Princeton, New Jersey? I can help you make the best deal. Call me at 609-915-9665 now !
Buying or Selling a Property is a Major Life Decision
It has serious financial and emotional implications and is a major part of the American dream. Whether you’re buying your first house, selling your property, or renting in Princeton, New Jersey, you can trust me to work as your advocate throughout the buying, selling or renting process.
What Type of Property ?
- Single or Multiple Family Homes
- Single-family homes: These come in all sizes, and styles; they may be built on very large or very small pieces of land (lots).
- Multiple family homes: These include duplexes, townhomes and condos.
- Apartment living is another choice
- Your Needs
- How many bedrooms do you need?
- How many bathrooms?
- Special purpose rooms desired:
- Recreation / TV
- Office / study
- Sewing / crafts / hobby room
- How much storage space/closet space?
- Your Lifestyle
- Do you have pets?
- Do you want recreational facilities (pool, Tennis courts, etc.) nearby?
- Do you like to (and have time to) take care of a yard, garden, etc.
- Do you like to fix things, paint, etc.?
- Do you want to be able to fix up a place to suit your own style?
10 Important Ways How I can Help a Home Seller in Greater Princeton Area
- Expertise: I am experienced and highly knowledgeable of the local market. I understand the legal and financial aspects of buying and selling a house, the local laws governing real estate transactions, and the right price range for a particular house. With my expertise, I can help sellers get the maximum value for my house.
- Negotiation Skills: Negotiating a good price for a house is a crucial part of selling a house. I am experienced negotiator and can help sellers get the best price for my house. I also understand the dynamics of the market and can help sellers set a realistic price for the house.
- Networking: I have an extensive network of contacts which includes potential buyers, lenders, appraisers, and other professionals involved in the house buying process. This network can help sellers find the right buyers for my property and get the best deal.
- Listing Services: I can list a property in multiple MLS (Multiple Listing Service), which is a database of houses for sale. This makes it easier for potential buyers to find the property and increases the chances of selling it quickly.
- Advertising: I know the best ways to advertise a property and can help sellers increase the visibility of your house. I can organize open houses, put up signs, and use other marketing tools to make sure that the property gets maximum exposure.
- Paperwork: Selling a house requires a lot of paperwork which can be overwhelming for a seller. I can take care of all the paperwork and ensure that all the documents are in order. This will save the seller a lot of time and hassle.
- Showings: I can also help with showings. I can arrange for potential buyers to view the property and can also accompany them during the showing. This can help the seller gauge the interest level of the potential buyer and determine the right offer for the property.
- Inspections: I can arrange for house inspections which are essential to ensure that the property is in good condition. I can also help the seller address any issues that may come up during the inspection.
- Contingencies: I can help the seller understand the contingencies that may be included in an offer. I can also help the seller negotiate with the buyer’s agent to ensure that the contingencies are favorable to the seller.
- Support: Selling a house can be stressful, and I can provide valuable support and guidance throughout the process. I can answer questions, provide advice, and handle any issues that may arise during the sale. This can make the process much smoother for the seller.
10 Ways I can Help a Home Buyer in Greater Princeton Area
- Knowledge of the local area: As a real estate agent in Princeton, NJ, I have extensive knowledge of the local area and can provide valuable insights to home buyers. I understand the local market and know the best neighborhoods to buy a home in. I can also provide information on the area’s schools, recreational facilities, and public transportation.
- Home Showings: I can arrange for home showings for potential buyers and accompany them during the viewing. This can help buyers get a better understanding of the property and determine if it meets their needs. I can also answer any questions that buyers may have about the property or the area.
- Negotiation Skills: Negotiating a good price for a home is an essential part of the home buying process. I am an experienced negotiator and can help buyers get the best deal on a home. I understand the dynamics of the market and can help buyers set a realistic price for the home.
- Financing Options: I can help buyers understand the different financing options available and how they can take advantage of them. I can also provide information on the loan process and help buyers get pre-approved for a loan.
- Networking: As a real estate agent, I have an extensive network of contacts which includes potential buyers, lenders, appraisers, and other professionals involved in the home buying process. This network can help buyers find the right home and get the best deal.
- Paperwork: Buying a home requires a lot of paperwork which can be overwhelming for a buyer. I can take care of all the paperwork and ensure that all the documents are in order. This will save the buyer a lot of time and hassle.
- Contingencies: I can help buyers understand the contingencies that may be included in an offer and negotiate with the seller’s agent to ensure that the contingencies are favorable to the buyer.
- Home Inspections: I can arrange for home inspections which are essential to ensure that the property is in good condition. I can also help buyers address any issues that may come up during the inspection.
- Closing Process: I can guide buyers through the closing process and ensure that all the paperwork is in order. I can also help buyers understand the legal documents and ensure that they get the best deal on the home.
- Support: Buying a home can be stressful, and I can provide valuable support and guidance throughout the process. I can answer questions, provide advice, and handle any issues that may arise during the purchase. This can make the process much smoother for the buyer.
Why Rosy as your Realtor ?
- Your Best Interest: I will work to ensure your purchase or sale stays on track and on time. You will receive outstanding customer service, professional expertise, and learn about other services that can enhance the value of your purchase or sale of house.
- My Best Efforts:
- The real estate process requires negotiation of complex issues; I am committed to working in your best interests. I will help you secure the best possible price, with the most favorable terms, in the shortest period of time.
- My goal is to help you, not just once, but whenever you need real estate assistance, and to build a lifelong relationship based upon mutual trust and understanding.
- My Commitment
- I will listen to your goals, and recommend ways to help you achieve them.
- I am confident that after you work with me, you’ll see that my dedication is to you, not “the deal”.
- You can count on me because I will:
- Answer your questions
- Answer your emails
- Answer your phone calls
Why Greater Princeton Area Real Estate ?
Why Coldwell Banker Residential Brokerage, Princeton, New Jersey ?
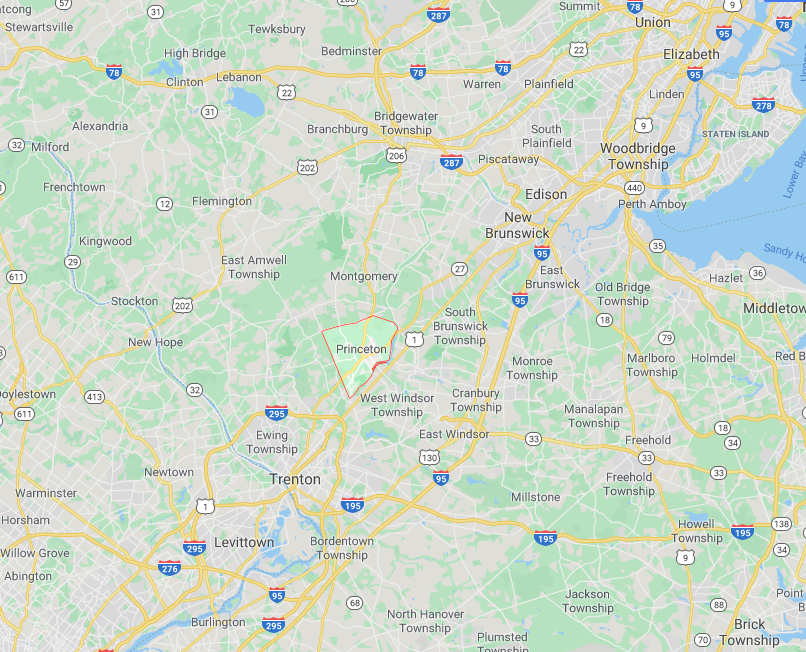
- I work for Coldwell Banker Residential Brokerage in Princeton, New Jersey. Our office is within minutes from the Princeton – Junction train station. It is accessible from Rt 1, Rt 206, Rt. 27, I-95, I-295.
- The iconic Coldwell Banker brand is synonymous with a gold standard of service, cementing its status as a premier real estate authority for present and future generations of discriminating buyers and sellers everywhere.
- We offer:
- Relocation Services
- Home Warranty (Assurance)
- Mortgage Services
- Title Search and Insurance
Top 5 related topics for further reading:
- New Jersey real estate trends and forecasts
- Financing options for homebuyers in New Jersey
- Home inspection and appraisal process in New Jersey
- Negotiating strategies for buying a home in a competitive market
- Moving and relocation tips for New Jersey homebuyers

